
Fig. 2.
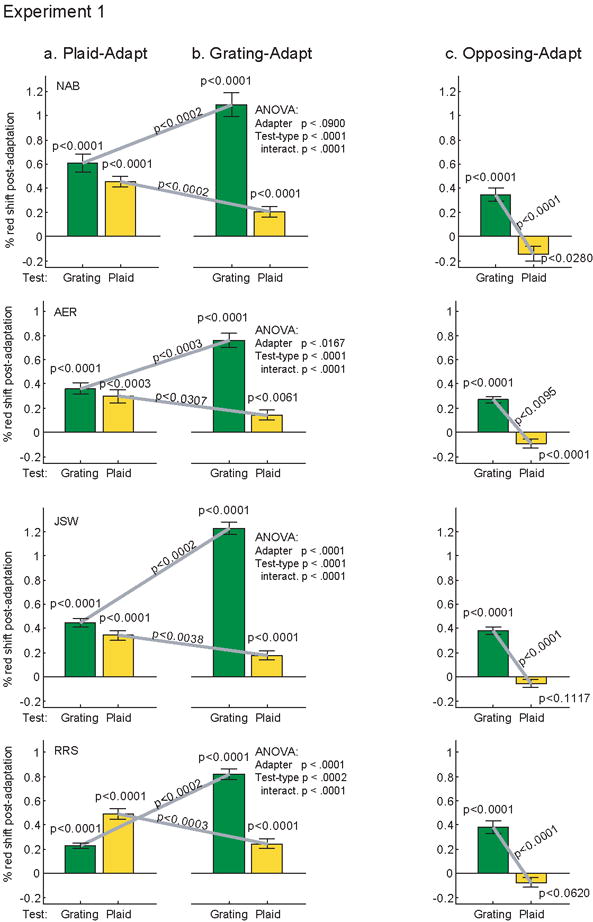
Results of Experiment 1: effect of adapting to (a) a plaid, (b) a grating, or (c) a grating alternating with a plaid of an opposite color/orientation. The aftereffect measure reported is the change in the intensity of the red phosphor between the pre- and post-adaptation null. A 1% change in phosphor intensity corresponds a 0.091% change in L-cone (red) contrast. Error bars denote +/- 1 standard error of the mean. The results of a 2×2 ANOVA on stimuli type (grating, plaid) and adapter (grating, plaid) are shown at the right of (b). All other p values are calculated by t-tests comparing the pre- to post-adaptation nulls, and have been corrected for multiple comparisons using the Bonferroni-Holm method.