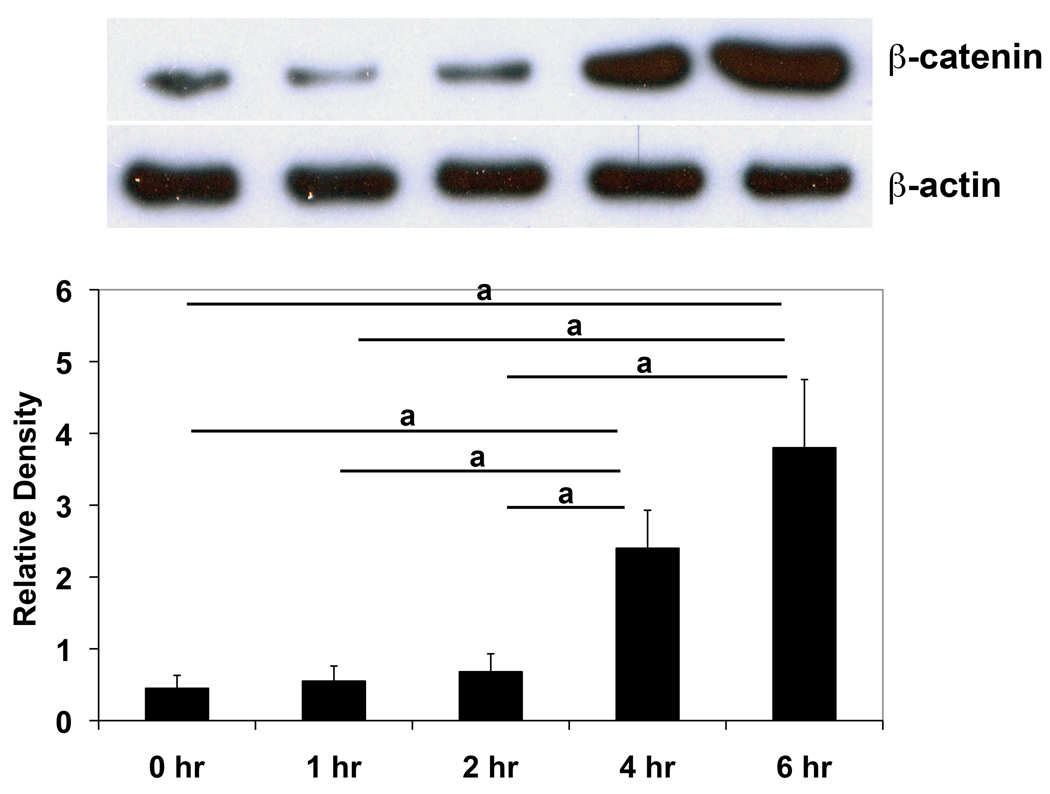
Figure 3. LRAP treatment elevates β-catenin protein level in ST2 cells.
(A) Western blot analysis of cytosolic β-catenin in ST2 cells cultured in the presence of LRAP (10 ng/ml) for various time periods. β-actin was used as an internal control. (B) Band intensity ratio was calculated by normalizing the band intensity for each sample with the band intensity of β-actin. The graph represents mean±SD (a: P<0.01).

