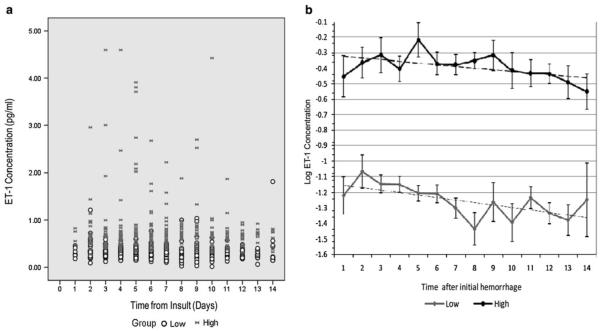
Fig. 1.
Raw population values of CSF ET-1 concentrations (pg/ml) over the first 14 days from the time of insult from 106 aSAH patients (a). Raw data are denoted as samples from high ( ) and low (open circle) groups as identified by trajectory analysis (a). Log ET-1 concentrations versus time from insult (days) in high (filled circle) and low (filled diamond) groups as identified by trajectory analysis (b). Data are presented as mean log ET-1 values measured per day. The model shows two groups of patients with significantly different (P < 0.001) ET-1 values. Patients in low group (n = 59, 56%) have relatively low ET-1 values (mean at day 1 = 0.31 pg/ml; SE = 0.04; mean at day 14 = 0.41 pg/ml; SE = 0.15) and those in high group (n = 47, 44%) have higher ET-1 values (mean at day 1 = 0.65 pg/ml; SE = 0.08; mean at day 14 = 0.61 pg/ml; SE = 0.06)

