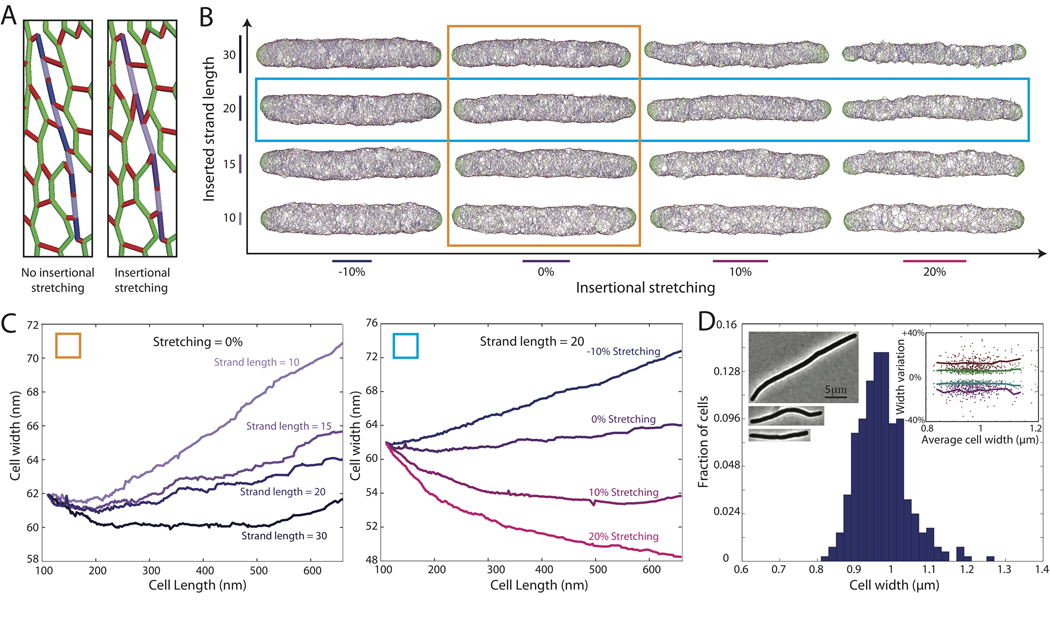
Figure 3. Cell width decreases as strand length and/or insertional stretching is increased.
(A) Schematic of insertional stretching: Stretching of new strands before relaxation (purple) results in fewer glycan subunits per unit length. (B) Cell walls grown with uniform insertion to three times their original length, with insertional stretching ranging from −10% (i.e., compression) to +20% (x-axis) and inserted strand lengths ranging from 10 to 30 (y-axis). (C) Average local width as a function of length for (left) cells in orange column of B with different strand lengths and 0% insertional stretching and (right) cells in cyan row in B with different levels of insertional stretching and L=20 (blue row in B). The width remains constant as the cell wall elongates for strands of length 20 with 10% insertional stretching. (D) Local width remains roughly constant (0.97±0.07 µm, 312 cells) in filamentous E. coli K12 cells treated with cephalexin. Left insets: phase-contrast micrographs of typical cells (Scale bar: 5 µm). Right inset: Scatter plot of width variability within single cells, similar to Fig. 1B,C.

