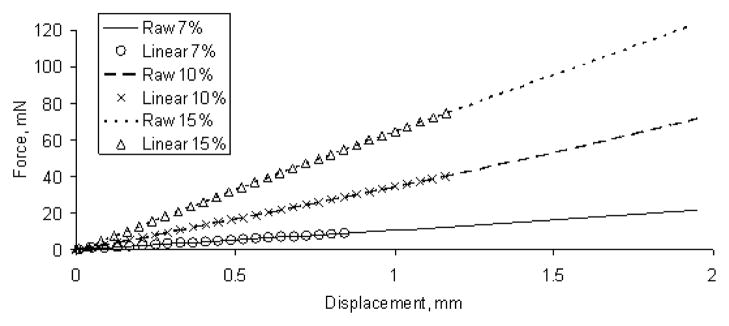
Fig. 3.
Force-displacement data for one sample of each gelatin phantom (Sample type 1, refer to Table I). The three symbols represent the linear region for the three gelatin phantoms. The three line types represent the raw data for the three gelatin phantoms.

