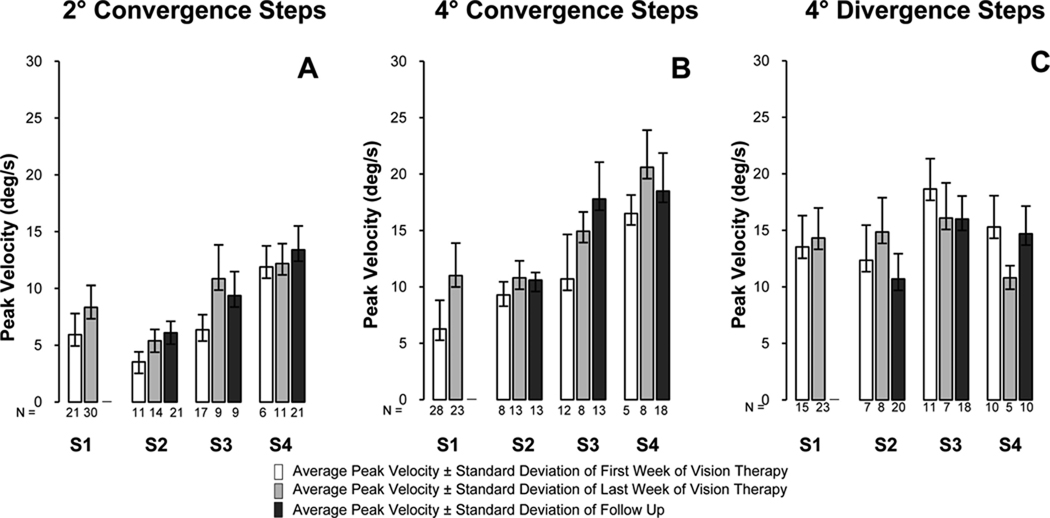
FIGURE 6.
Average peak velocity ± one standard deviation for subjects S1 through S4 for 2° convergence (plot A), 4° convergence (plot B), and 4° divergence (plot C) responses from the first week of training (one bar), last week of training (light gray bar), and during a follow-up session (dark gray bar). The number of responses analyzed is denoted under each bar.

