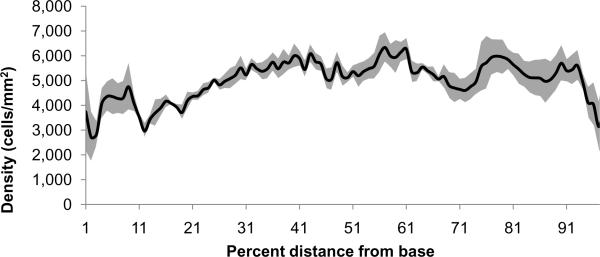
Fig. 10.
Graph showing SGN density (cells/mm2) as a function of percent distance from base to apex in five animals with standard error shown as grey shading. Since the basal orthogonal area peak (Fig. 7) was greater than the corresponding cell number peak (Fig. 9), there is a resulting decrease in density. Though not statistically significant, it appears that there are areas of greater cell density in the middle region from 56 to 62% and in the area-constricted regions near 38% and 76%.

