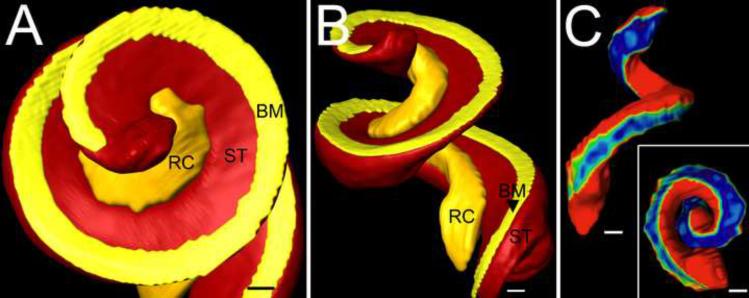
Fig. 6.
3D relationships of RC. Figure shows a 3D isosurface reconstruction of basilar membrane (BM), scala tympani (ST) and Rosenthal's canal (RC) in apical (panel A) and side (panel B) views. Panel C shows the width of the bone between ST and RC with a color map (blue and red indicate 5 μm and 30+ μm respectively). Bars indicate 100 μm in A, B and C.

