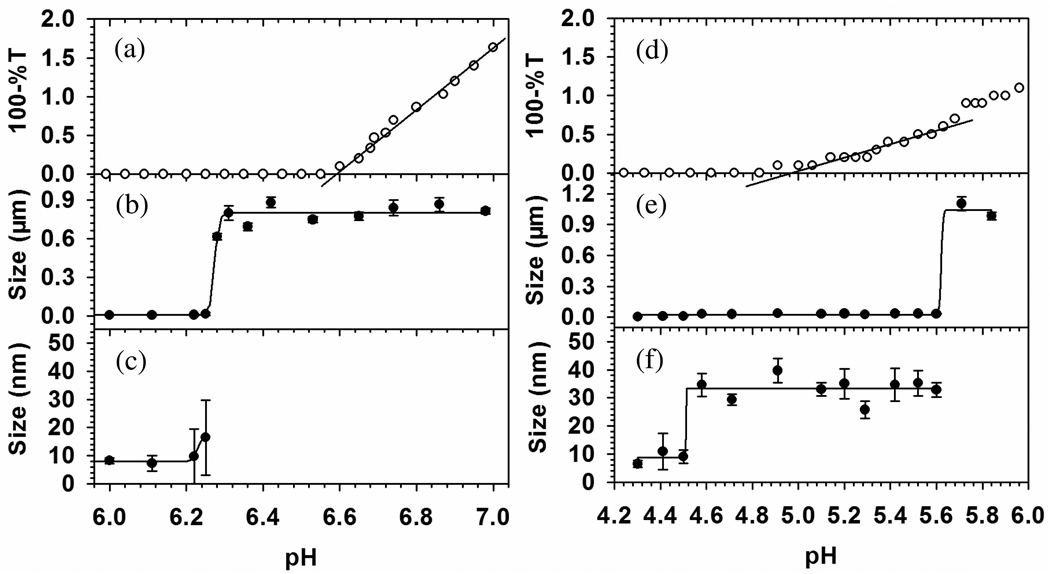
Figure 6.
Turbidimetric titration (a) for BSA–TTMA and (d) for BLG–TTMA, and DLS (b, c) for BSA–TTMA and (e, f) for BLG–TTMA both with I = 105 mM at selected pH near pHc. 10 ml mixed solution containing 0.6 µM BSA or 1.6 µM BLG and 0.2 µM TTMA was titrated with 0.1 N NaOH to increase pH. Average and standard deviation of apparent diameter were given here from 5 duplicates.

