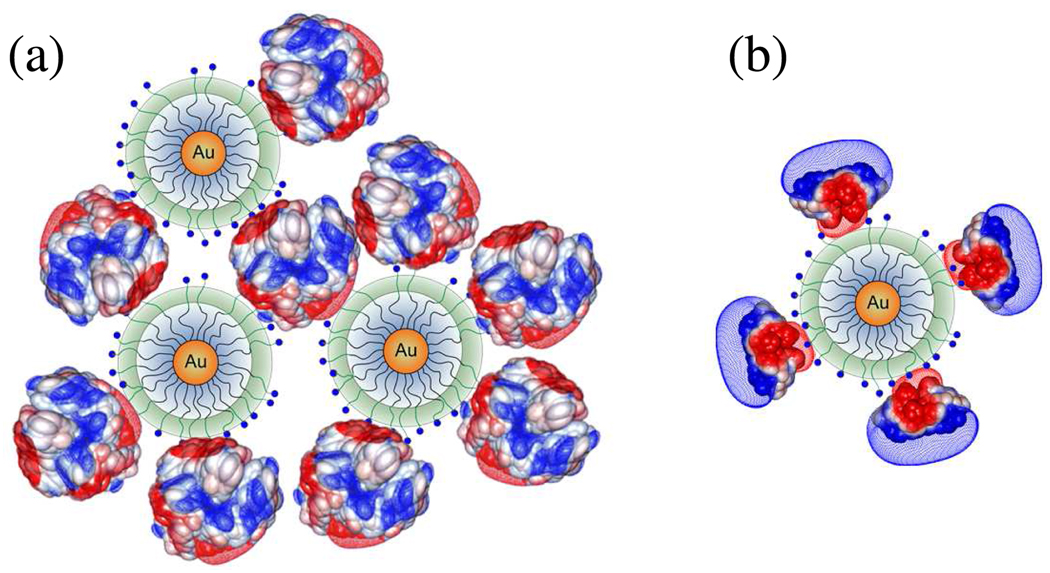
Figure 8.
Depiction of aggregation for (a) BSA–TTMA (pH 6.3–6.8) and for (b) BLG–TTMA (pH 4.6–5.6). Diameters (DLS): BSA, 7.4 nm; BLG dimer, 5.4 nm; TTMA, 10 nm. Multiple negative charge patches of BSA interact with several TTMA and form large complex aggregates; single negative patch of BLG binds to TTMA yielding an effectively positive complex. See Figure 6.

