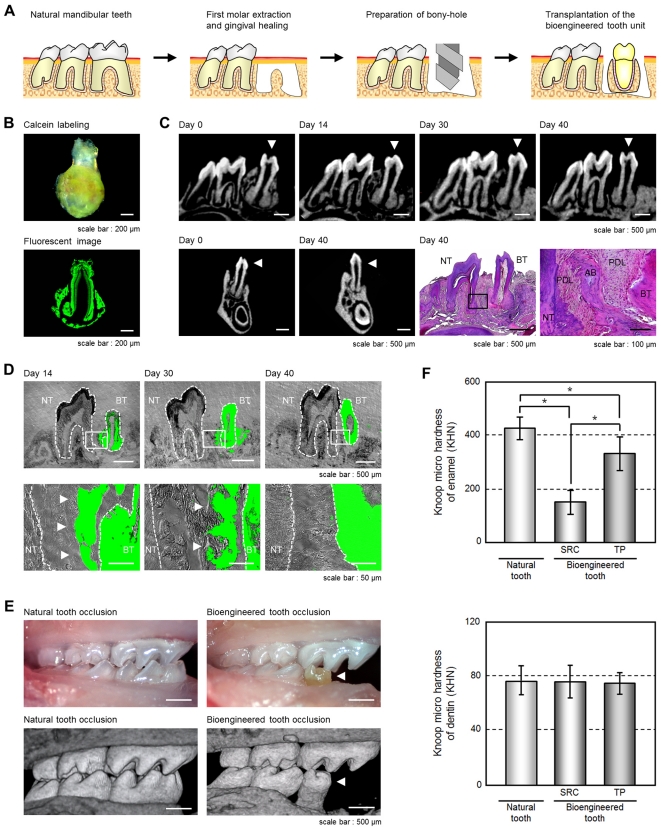
Figure 2. Engraftment and occlusion of a bioengineered tooth unit in a tooth loss model.
(A) Schematic representation of the protocol used to transplant a bioengineered tooth unit in a murine tooth loss model. (B) Photograph (Upper) and sectional image (Lower) of a calcein-labeled bioengineered tooth unit at 60 days post transplantation in an SRC. Scale bar, 200 µm. (C) Micro-CT images of a bioengineered tooth unit (arrowhead) in cross section (upper) and frontal section (first and second figures from the lower left) during the processes of bone remodeling and connection between the recipient jaw bone and alveolar bone of the tooth unit. Histological analysis of the engrafted bioengineered tooth unit at 40 days post transplantation was also performed. (Scale bar, 500 µm and 100 µm in the lower and higher magnification figure; third and fourth figure from the lower left). NT, natural tooth; BT, bioengineered tooth; AB, alveolar bone; PDL, periodontal ligament. (D) Sectional images of a calcein-labeled bioengineered tooth unit at 14, 30 and 40 days post-transplantation. The calcein-labeled bone of the bioengineered tooth units (arrowhead) was found to gradually decrease from the outside and finally disappear at 40 days post-transplantation. Scale bar, 500 µm (upper), 50 µm (lower). NT, natural tooth; BT, bioengineered tooth. (E) Oral photographs (upper) and micro-CT (lower) images showing occlusion of natural (left) and bioengineered teeth (right). Scale bar, 500 µm. (F) Assessment of the hardness of a bioengineered tooth. Knoop microhardness values of the enamel (upper) and dentin (lower) of a bioengineered tooth at 60 days post-transplantation in a subrenal capsule (SRC) and at 40 days post-transplantation in jawbone (TP) were compared with those of natural teeth in 11-week-old mice. Error bars show the standard deviation (n = 5). *P<0.01 (t-test).

