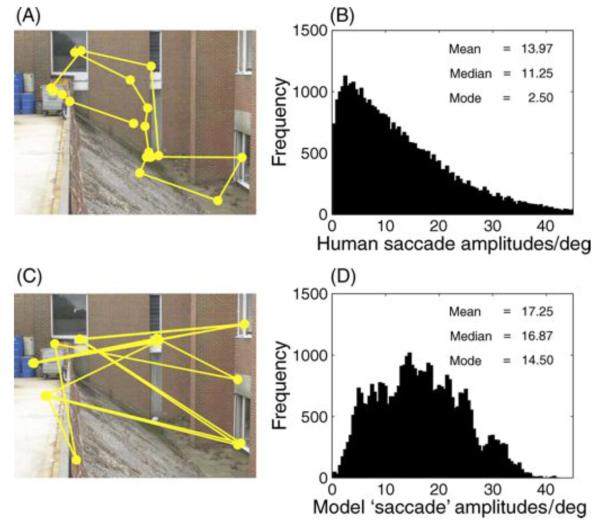
Figure 2.
Saccade amplitudes from humans and the salience model. (A) Sample scan path from one participant looking at a photographic scene for 5 s. (B) Overall distribution of saccade amplitudes from humans looking at photographic scenes (N = 39,638 saccades). Data are taken from 22 participants, viewing 120 images for 5 s each. These data are drawn from the participants in Tatler and Vincent (2009) and full participant information can be found in this published paper. (C) Sample scan path from Itti's salience model. Simulation data are generated using the latest version of the saliency tool box downloaded from http://www.saliencytoolbox.net using the default parameters. Full details of the model can be found in Walther and Koch (2006). The simulation shown here was for the same number of “saccades” as recorded for the human data shown in (A). (D) Overall distribution of simulated saccade amplitudes from the salience model (N = 39,638 simulated saccades). Separate simulations were run for 22 virtual observers “viewing” the same 120 images as the human observers used in (B). For each image, the virtual observer made the same number of simulated saccades as the human observer had on that scene. The salience model produces larger amplitude saccades than human observers and does not show the characteristic positively skewed distribution of amplitudes.

