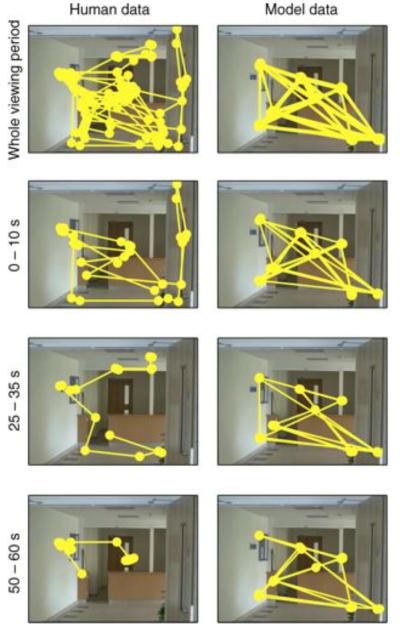
Figure 3.
Behaviour during extended viewing for (left) a human observer and (right) the salience model. The human observer viewed the scene for 60 s with no instructions. The model simulated the same number of fixations as made by the observer during viewing (N = 129 fixations). Data are shown for the entire viewing period (top row). Note that the salience model simply cycles around a small number of locations, whereas the observer does not. The lower three rows show data divided into the first 10 s, the middle 10 s, and the !nal 10 s of viewing, with matched portions from the simulated sequence of fixations generated by the salience model. Simulation data were generated using the latest version of the saliency tool box downloaded from http://www.saliencytoolbox.net using the default parameters. Full details of the model can be found in Walther and Koch (2006).

