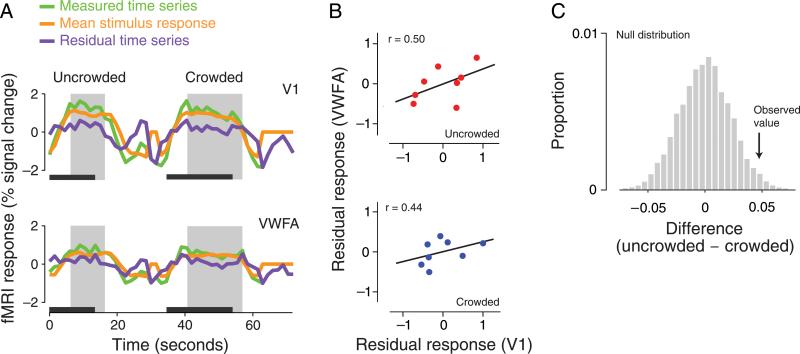
Figure 4.
Inter-area correlation analysis. (A) Sample fMRI responses as a function of time for two ROIs in a single subject (top: V1; bottom: VWFA). Two full trials are shown (left: uncrowded; right: crowded). Three curves are plotted: green, measured time series; orange, mean stimulus-evoked response (estimated using deconvolution separately for crowded and uncrowded trials, different trial durations, ROIs, and subjects); purple, residual time series after removing the mean stimulus-evoked response. Dark gray bars indicate the duration of each trial. Shaded gray rectangles indicate the epoch of residual time series that was extracted for correlation analysis, shifted relative to the trial to account for hemodynamic delay. (B) Within-trial inter-area correlation analysis. Each data point represents a single time point of the residual responses in each of the two ROIs during a single representative trial of the experiment (top: uncrowded trial; bottom: crowded trial). A best-fitting regression line is drawn only for illustration, because successive time points may exhibit serial dependence and hence may not be independent. (C) Statistical significance of the effect of crowding on inter-area correlation. A non-parametric permutation test was performed by randomly shuffling the “uncrowded” and “crowded” trial labels and then recomputing the correlations (see Methods section). Repeating this 10,000 times produced a distribution of correlation differences under the null hypothesis. The proportion of the null distribution greater than the observed difference provided a one-sided p-value.

