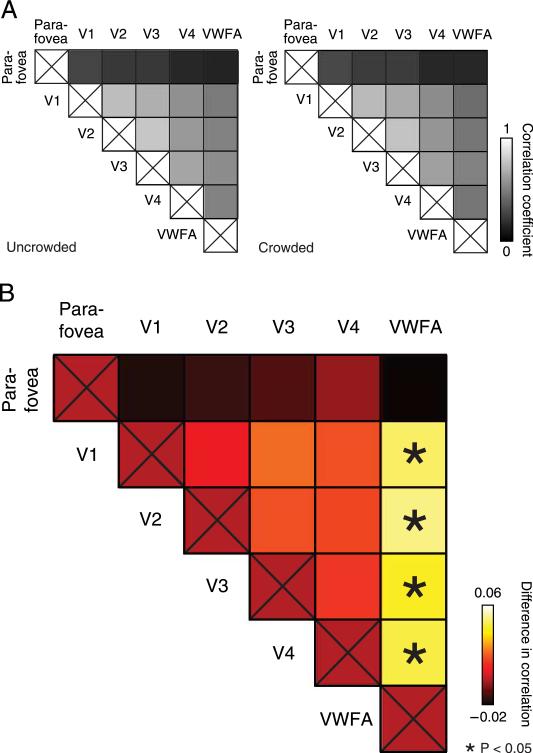
Figure 5.
Crowding changed the response correlations between pairs of visual areas. (A) Correlation coefficients for (left) uncrowded trials and (right) crowded trials. Each square indicates the correlation between residual time courses (within-trial analysis combining trials across n = 4 subjects), for a pair of ROIs (see Methods section). (B) Differences in correlations (uncrowded – crowded). Asterisks represent ROI pairs showing a statistically significant difference in correlation (*p < 0.05, one-sided permutation test, within-trial analysis combining trials across n = 4 subjects). The statistical significance of the V1–VWFA, V2–VWFA, V3–VWFA, and V4–VWFA correlation differences was confirmed in a complementary analysis using paired t-tests, i.e., treating inter-subject variability as a random factor (see Methods section and Results section).

