Figure 7.
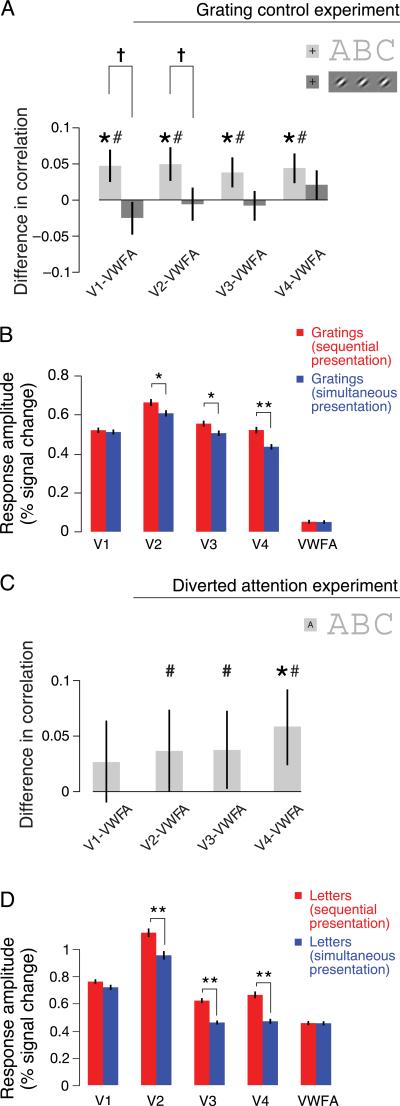
Grating and diverted attention control experiments. (A) Inter-area correlations were indistinguishable for simultaneous versus sequential presentation of grating patches, which contain only a single feature, unlike letters, which contain multiple features that must be integrated. Differences in correlations (for sequential versus simultaneous presentations) are shown for the letter experiment (light gray bars) and the control experiment with gratings (dark gray bars), for the four ROI pairs that included VWFA. The total number of trials (530) was identical for letters and gratings, ensuring equal statistical power in the two experiments. Error bars are 68% confidence intervals estimated from the bootstrapped distribution of correlation differences (within-trial analysis). Asterisks represent ROI pairs showing a statistically significant difference in correlation (*p < 0.05, one-sided permutation test, within-trial analysis, combined across n = 4 subjects, analyzed separately for the main letter experiment and the grating control experiment). Number signs represent ROI pairs showing a statistically significant difference in correlation in a complementary (concatenated, see Methods section) version of the analysis (#p < 0.05, one-sided permutation test, concatenating across n = 4 subjects). Daggers represent ROI pairs showing a statistically significantly larger difference in correlation for letters than for grating patches (†p < 0.05, one-sided bootstrap test, within-trial analysis, combined across n = 4 subjects). (B) Mean fMRI response amplitudes in the grating control experiment. Error bars are 68% confidence intervals estimated from the bootstrapped distribution of mean response amplitudes. Asterisks indicate statistically significant differences in response amplitudes (*p < 0.05 and **p < 0.001, one-sided permutation test, n = 4). (C) Inter-area correlation differences for letters persisted when attention was diverted. Differences in correlations (uncrowded – crowded) are shown for the diverted attention control experiment for the four ROI pairs that included VWFA (n = 3 subjects). Same conventions as in (A). (D) Mean fMRI response amplitudes in the diverted attention control experiment. Same conventions as in (B).

