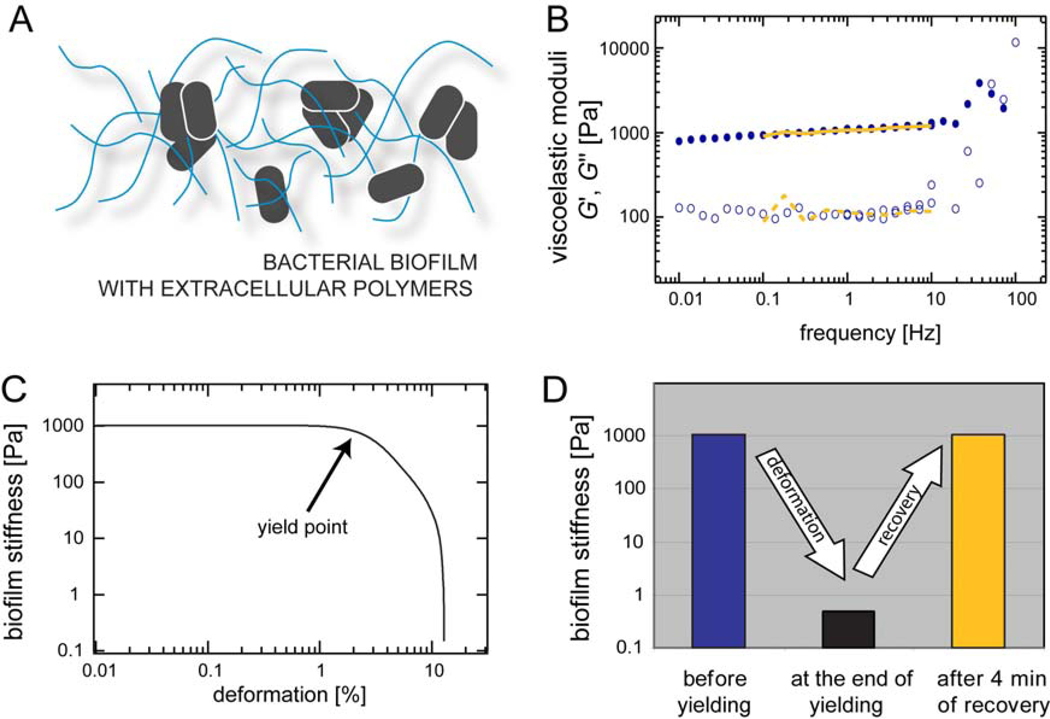
Figure 1.
(A) Schematic representation of a bacterial biofilm. Bacteria grow in distinct localized colonies and secrete extracellular polymers that create a 3-dimensional scaffold around them. (B) The linear viscoelastic response of a P.a. biofilm is determined over a broad range of frequencies. We compare the viscoelastic response before and 4 min after the biofilm was forced to yield. The elastic modulus G’(f) is depicted by closed symbols and full lines, the viscous modulus G”(f) is depicted by open symbols and dashed lines. (C) Mechanical response of a P.a. biofilm at large deformations. Beyond a critical deformation the biofilm yields and its apparent stiffness is decreased by more than three orders of magnitude. (D) Schematic representation of the rupture/recovery process as shown in detail in (B) and (C). The depicted stiffness values are taken from graphs (B) and (C).

