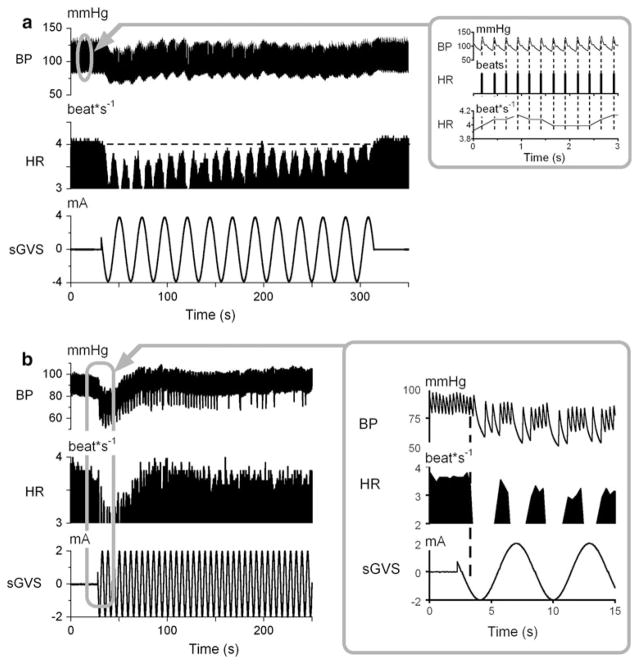
Fig. 1.
a Binaural sGVS in Rat #578 at 0.025 Hz, 4 mA (bottom trace) caused a drop in BP (1st trace) and HR (2nd trace). BP and HR oscillated at twice the stimulus frequency (3rd trace). The horizontal dashed line denotes the initial HR and extends to its recovery after the end of the stimulus. Inset 1a, BP (1st trace), HR (2nd trace), and instantaneous HR (3rd trace) determined from peaks of systolic BP. (See text for description). b sGVS of Rat #588 at 0.17 Hz, 2 mA (bottom trace) caused large modulations in BP (1st trace) and HR (2nd trace) at twice the stimulus frequency (inset). Time base on abscissas in sec

