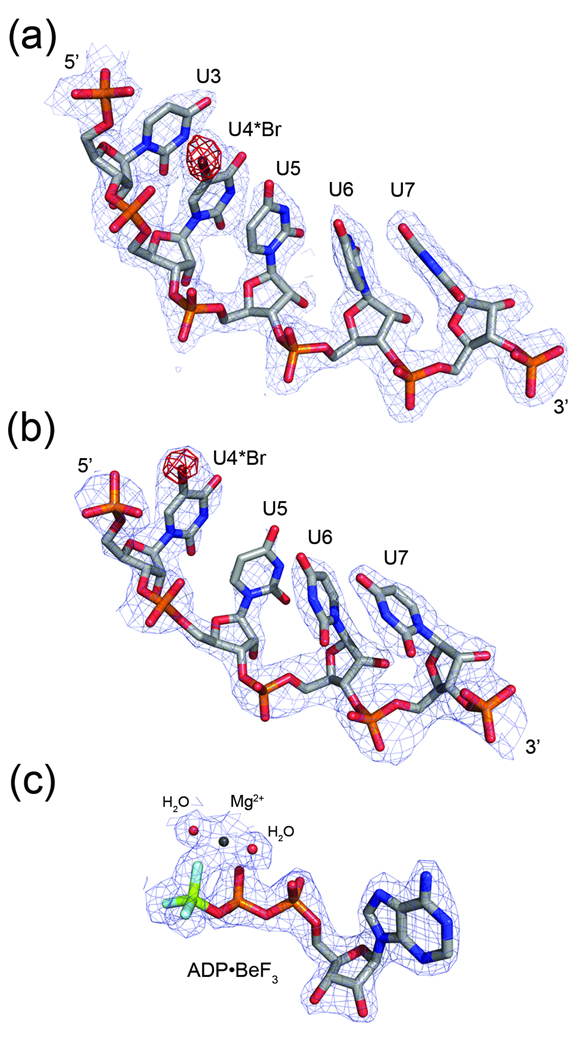
Fig. 2.
Electron density maps for selected ligands. Regions of the 2Fo-Fc maps (light blue) are shown for bound RNA in (a) the NS3-rU8Br4 structure (2.0Å) and (b) the NS3rU8Br4/ADP•BeF3 structure (2.3Å). Fo-Fc density calculated prior to adding bromine to U4 nucleotide residues in both models is contoured at 4σ and shown in red. (c) A 2Fo-Fc density map (light blue) for ADP•BeF3 bound to NS3 (2.05Å) is superimposed on the final model of the nucleotide, magnesium ion, and two coordinating water molecules.

