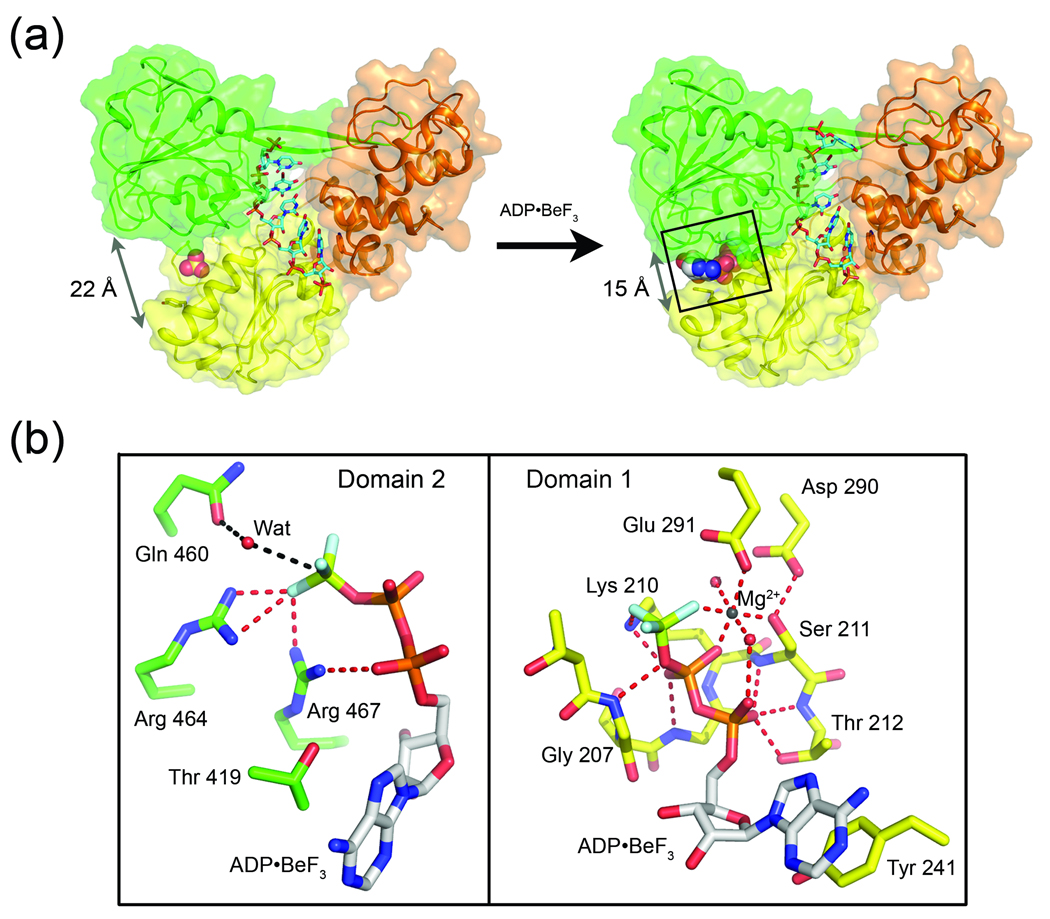
Fig. 4.
(a) Nucleotide induced structural rearrangement of NS3. The structure of nucleotide-free NS3-rU8Br4 (left) compared to NS3-rU8Br4/ADP•BeF3 (right). NS3 represented by cartoon ribbons with transparent surfaces while RNA is shown as sticks. Upon binding to ADP•BeF3 (shown as spheres), D1 (yellow) and D2 (green) pivot towards each other, collapsing around the nucleotide. Arrows indicate the distance between the Cα carbons of residues Lys 244 (D1) and Gly 468 (D2) before and after ADP•BeF3 binding. (b) Close-up of the NS3 ATPase site. Specific interactions between ADP•BeF3 and the two NS3 domains, D1 (right panel) and D2 (left panel), are diagramed separately for clarity. D1 residues (yellow carbons) in direct contact with either ADP•BeF3 or the Mg2+ ion are shown as sticks and labeled accordingly. D2 residues (green carbons) interacting with the nucleotide analogue are also labeled. Gln 460 from D2, which coordinates a water molecule near the γ-position of the nucleotide, is also shown.

