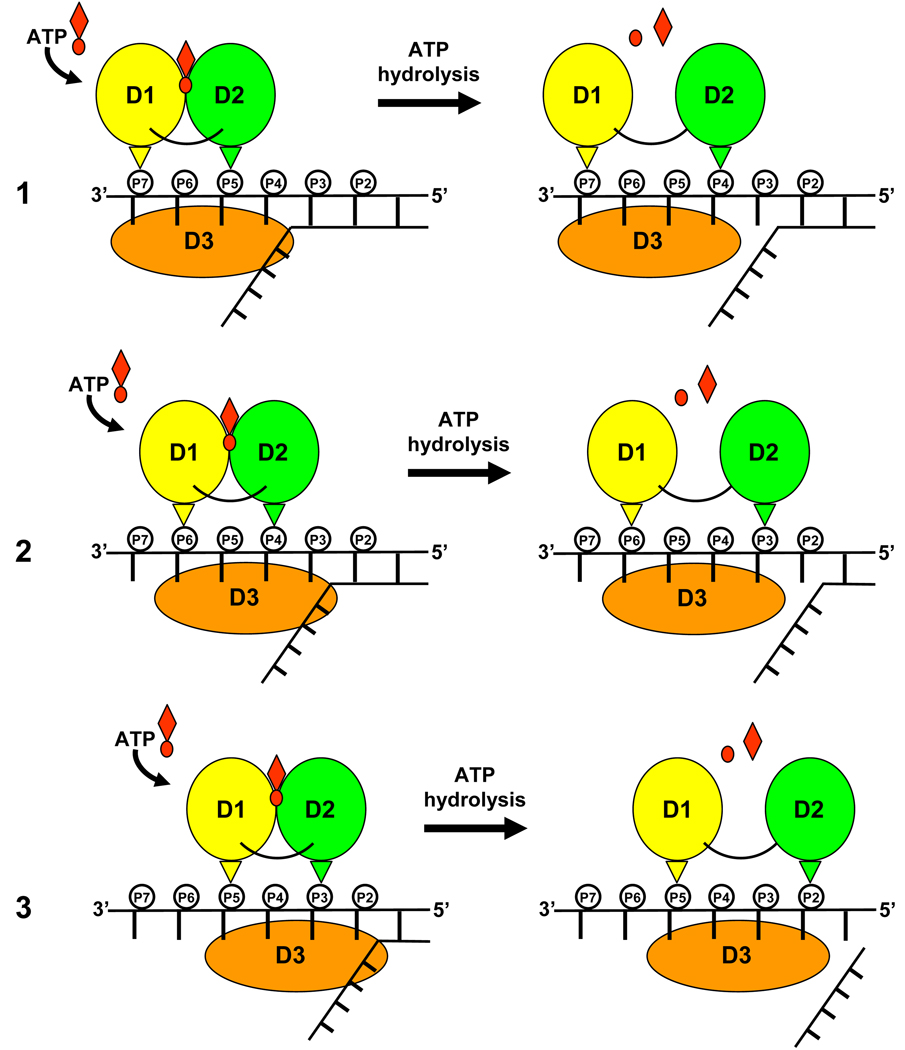
Fig. 7.
Schematic representation of NS3 stepping along an RNA tracking strand during multiple rounds of the ATPase cycle. Domains 1, 2, and 3 are colored yellow, green and orange respectively. The phosphodiester backbone of the tracking strand is shown as small circles labeled by nucleotide residue number (P7-P2, 5’→3’). The small, upside down triangles represent conserved Thr 269 of D1 (yellow) and Thr 411 of D2 (green). Three rounds of ATP binding and release are depicted (labeled 1–3).

