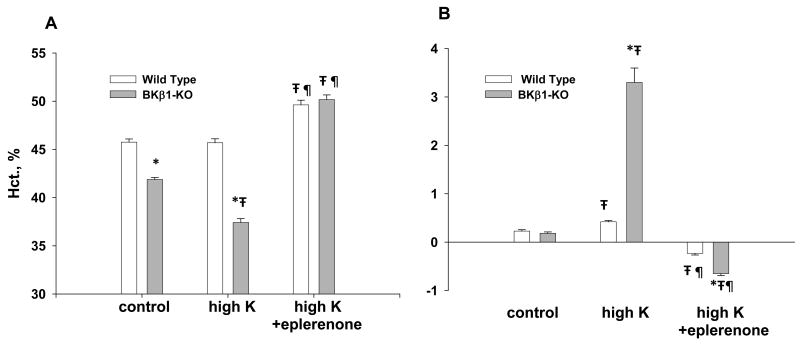
Figure 1.
Illustration of volume status, as determined by hematocrits (A) and weight change (A) of BKβ1-KO and WT on either control (normal K: 0.32% Na and 0.6% K) or high K (0.32% Na and 5.0% K) diets. *denotes significant difference (p<0.05) compared with WT using the unpaired t-test. ∓denotes significant difference compared with normal K (control) using ANOVA plus Student-Newman-Kuels test. ¶denotes significant difference compared with HK using ANOVA plus Student-Newman-Kuels test.

