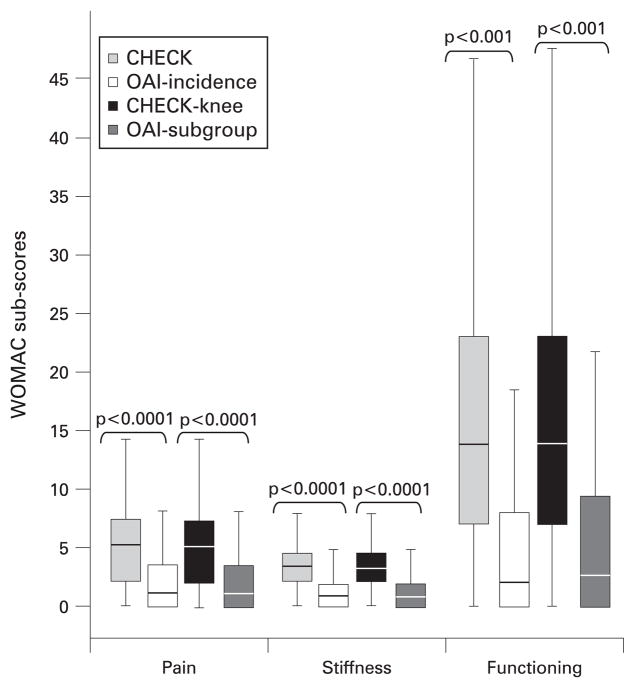
Figure 2.
Comparison of the three Western Ontario and McMaster Universities osteoarthritis index (WOMAC) subscales for pain, stiffness and functional disability between Cohort Hip and Cohort Knee (CHECK) and Osteoarthritis Initiative (OAI) and their subpopulations at baseline. Box whisker plot (median and 25th–75th percentiles) and p values are given. A higher score indicates more pain, stiffness and problems in physical functioning.

