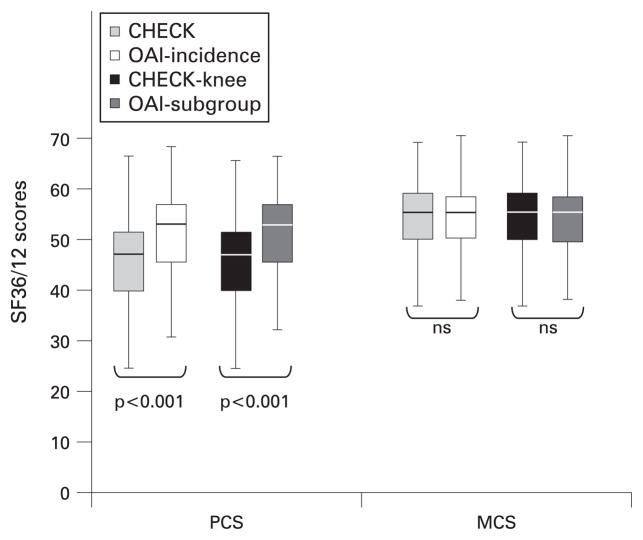
Figure 3.
Comparison of the physical component summary (PCS) scale and mental component summary (MCS) scale of the Short Form 36-item health status survey questionnaire (SF-36/12) between Cohort Hip and Cohort Knee (CHECK) and Osteoarthritis Initiative (OAI) and their subpopulations at baseline. Box whisker plot (median and 25th–75th percentiles) and p values are given. A higher score indicates a better health-related quality of life.

