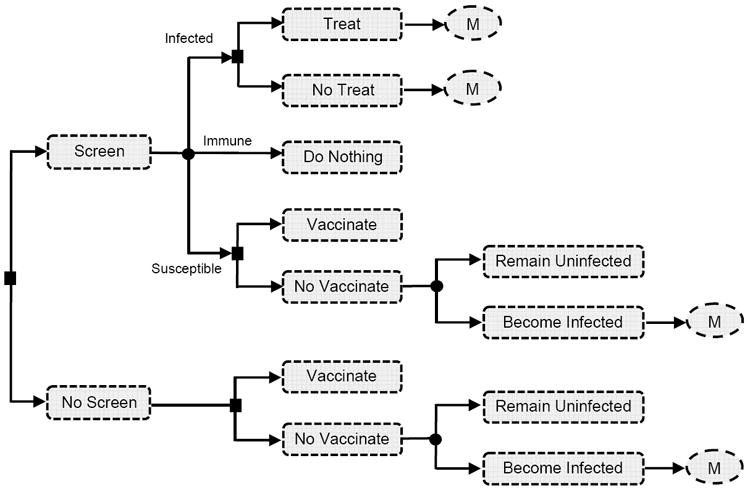
Figure 1. Schematic of decision model*.

* This figure shows the decision model for our analysis of hepatitis B screening, vaccination, and treatment in the United States. The circles with “M” in them denote our Markov model of disease progression in treated and untreated individuals (Figure 2). For our analysis of catch-up vaccination in China, the decision tree consists only of Screen with Vaccinate or No Vaccinate and No Screen with Vaccinate or No Vaccinate (along with the Markov model of infection).
