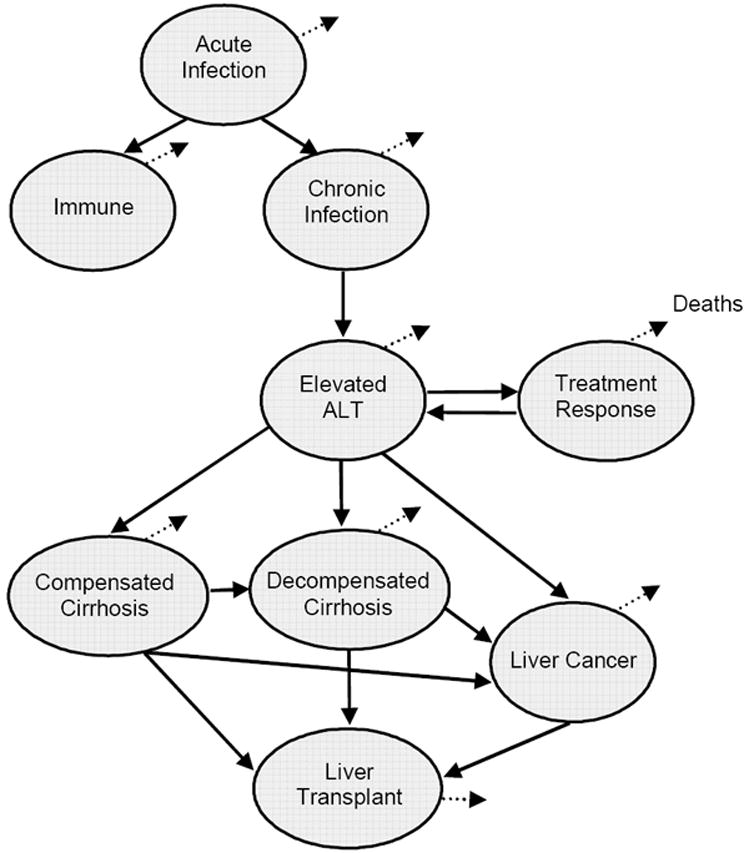
Figure 2. Schematic of Markov model of hepatitis B infection and progression*.

* ALT = alanine aminotransferase, a blood enzyme measuring the health of the liver. Circles represent health states. Lines represent transitions between those states. Dotted lines represent death. When exposed to hepatitis B, individuals develop acute infection. Acute infection causes individuals to either become immune (if their immune system is able to resolve the infection) or to develop chronic HBV infection. The first sign of progression to liver disease is an elevated ALT level (“Elevated ALT”), at which point individuals are eligible for treatment. Treatment may be successful in suppressing the virus (“Treatment Response”) or liver disease may progress to cirrhosis or liver cancer. Patients with cirrhosis or liver cancer are eligible for a liver transplant. Individuals in all states can die, at a rate equal to the background mortality based on the age of the individual plus the incremental mortality related to being in that particular health state.
