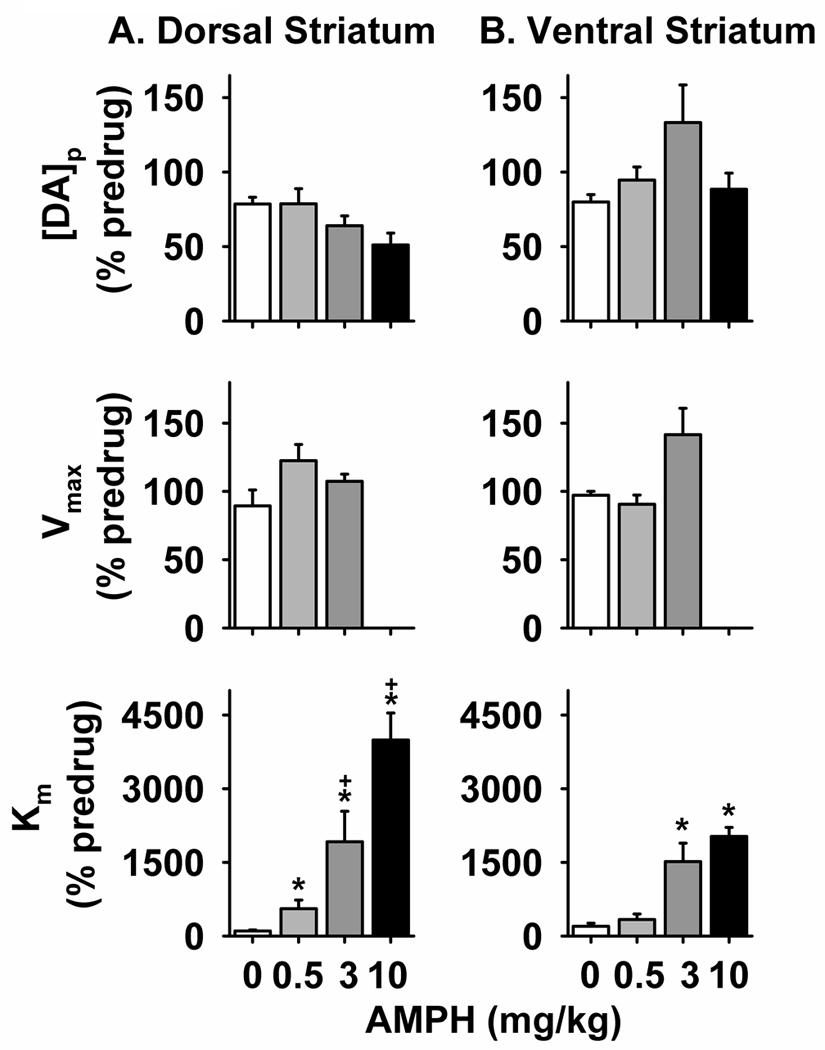
Figure 3. Effects of AMPH on best-fit parameters for DA release and uptake.

The 20- and 60-Hz responses represented in Figure 1 and Figure S1 were kinetically analyzed to determine parameters for exocytotic DA release ([DA]p, top) and neuronal DA uptake (Vmax, middle; Km, bottom). These values, determined for both the dorsal (A) and ventral (B) striatum, were expressed as a percent of the predrug value (% predrug). *significantly different than saline values (p < 0.05). +significantly different than 0.5 mg/kg (p < 0.05).
