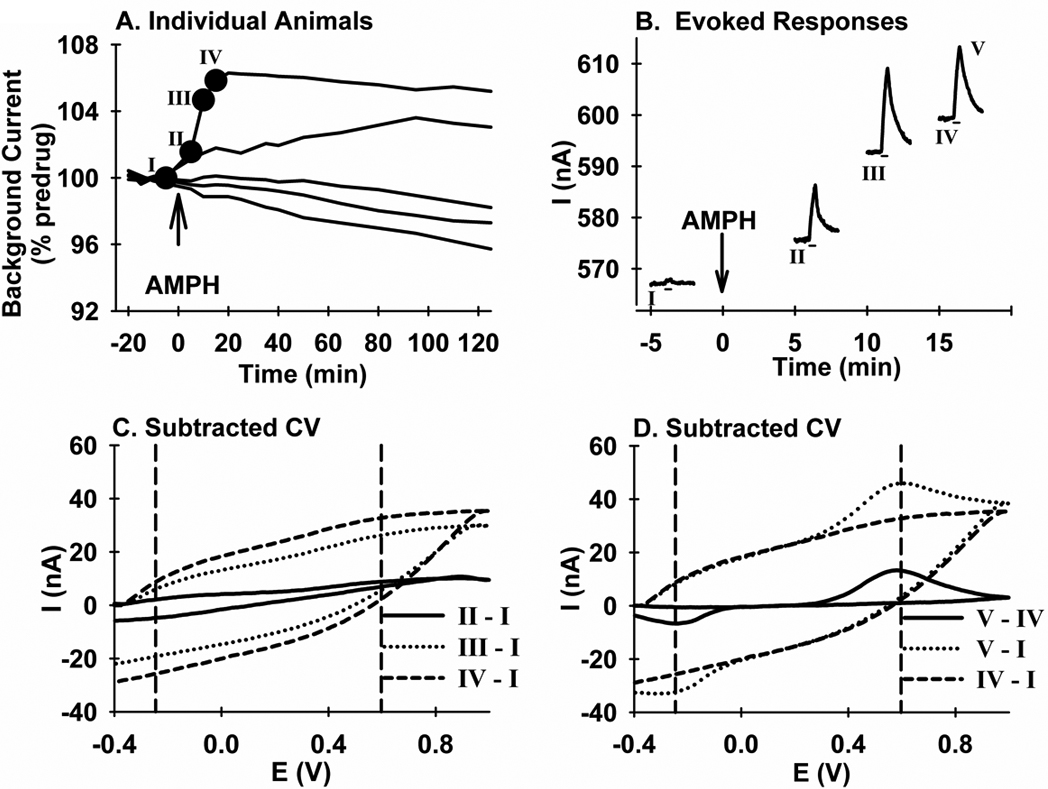
Figure 6. FSCV analysis of the change in background current elicited by AMPH.

A. Data are all responses from the 10 mg/kg-AMPH group collected in the dorsal striatum and averaged in Figure 6. B. Data are the evoked responses designated with the closed circles and Roman Numerals in A. Absolute current (i.e., not background subtracted) is plotted (I). C. Data are background-cyclic voltammograms (“Subtracted CV”) with current (I) as the ordinate, and voltage (E) as the abscissa. The pre-stimulation background current from time point I was subtracted from the corresponding region in time points II, III, and IV, and designated “II - I”, “III- I”, and “IV - I” , respectively. D. Data are background-cyclic voltammograms (“Subtracted CV”). The “IV - I” voltammogram from B is replicated, along with two additional voltammograms. The first, “V - IV”, was calculated by subtracting the pre-stimulation background current in IV from the peak of the evoked response also in IV, labeled in B as V. The second, “V - I”, was calculated by subtracting the pre-stimulation background current in I from the peak of the evoked response, V, in recording IV.
