
Figure 9.
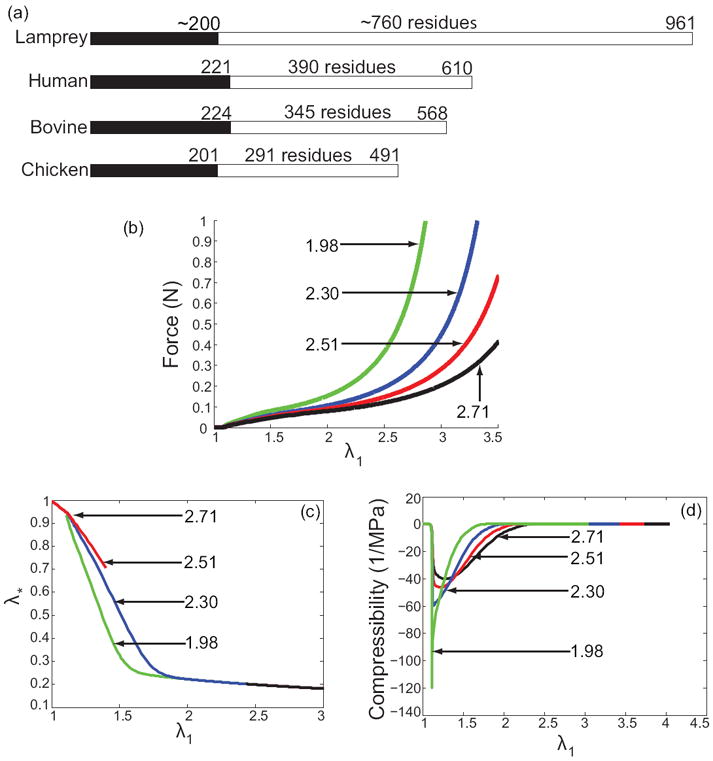
The effects of changing Lu/Lf. (a) Interspecies variability of the C-terminal part of fibrinogen’s Aα chain named the αC region. Black portion shows the α-helical segment of the Aα chain, white portion indicates the αC region. The ratio Lu/Lf could change depending on the animal species fibrin is derived from. In the figures, the values of Lu/Lf for each curve appear next to the arrows. (b) Larger stretches are seen at the same force with increasing Lu/Lf. (c) Hence, unfolding of fibrin molecules occurs at higher stretches as well. (d) The variation in fibrin network compressibility as a function of stretch with increasing Lu/Lf mirrors its variation with increasing Δ∏.