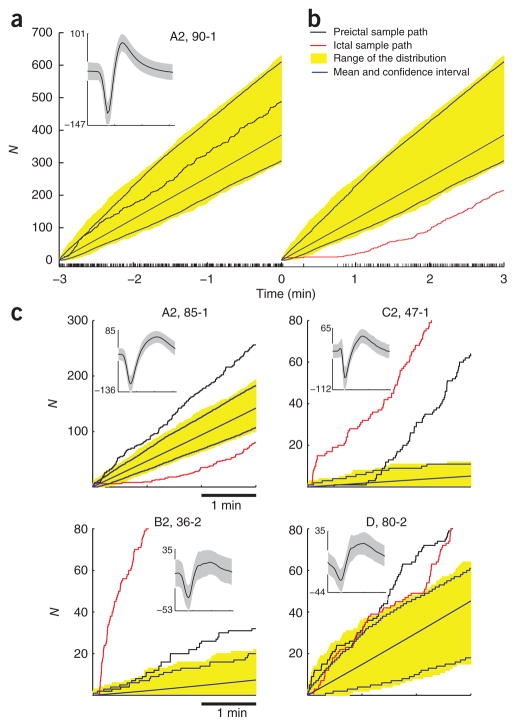
Figure 4.
Preictal and ictal modulations in spiking rates. (a) The neuronal spiking sample path N (neuron 90–1; A2: participant A, seizure 2). The corresponding spike train is shown at the bottom and the inset shows the mean ± 2 s.d. of all recorded spike waveforms. Seizure onset corresponds to time 0. For comparison purposes, the initial value of the sample path is set to 0. The yellow band corresponds to the range of the 3-min-long sample paths observed during a 30-min interictal period preceding the preictal period. Interictal sample paths in this distribution were obtained from an overlapping 3-min-long moving time window, stepped 1 s at a time. Blue curves and surrounding yellow band correspond to the average interictal sample path and the 95% confidence interval, respectively. A sample path was judged to have deviated from the interictal sample paths when it fell outside the range of the collection of interictal sample paths at any given time. (b) Neuron 90–1 transiently stopped spiking for tens of seconds just after the seizure onset. As expected, the sample path during the seizure did deviate from the observed interictal paths. The neuron’s spiking rate gradually recovered and eventually settled at the typical mean rate. (c) Four examples of preictal and ictal sample path deviations, one for each participant. Note that although the preictal and ictal sample paths are plotted along the same axis, they refer to a 3-min period before and after, respectively, the seizure onset.

