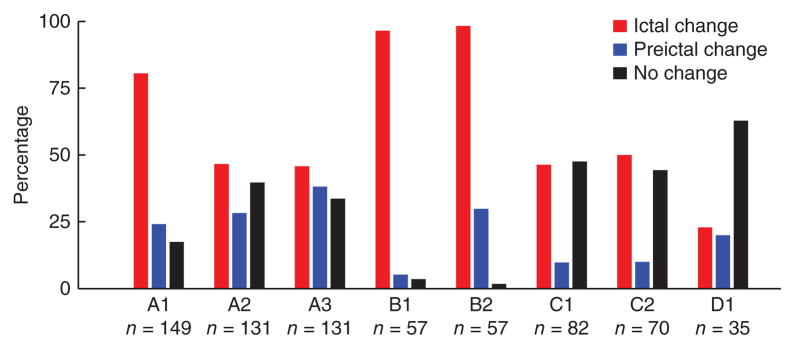
Figure 5.
Preictal and ictal sample path deviations with respect to an interictal period. Each bar indicates the percentage of preictal and ictal sample path deviations in the recorded neuronal population, for each participant and seizure. Sample paths and sample path deviations were defined as in Figure 4.

