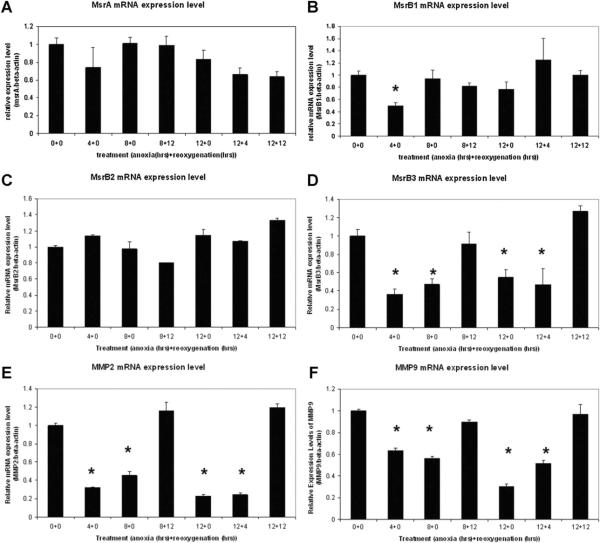
Fig. 2.
Real-time RT-PCR studies on Msr gene expression under oxidative stress induced by anoxia/reoxygenation. A: MsrA; (B) MsrB1; (C) MsrB2; (D) MsrB3; (E) MMP2; (F) MMP9. MsrB3 shows similar expression responses to MMP2 and MMP9 with their transcription levels downregulated when oxygen is depleted but regaining their normal expression levels quickly after a resupply of oxygen. Numbers show the hours of anoxia and reoxygenation respectively applied to MESCs. For example, 4+0 indicates 4 h of anoxia followed by 0 h of reoxygenation. Results with a statistically significant difference from the 0+0 group were labeled with asterisks (*)(P ≤0.05). Triplets were used in each experiment and two independent experiments were performed. Results were averaged with standard errors of mean (SEM) presented as error bars.

