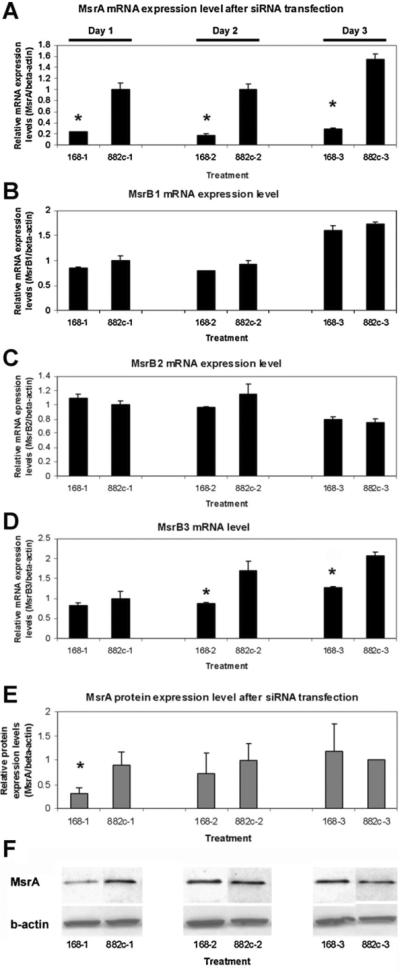
Fig. 3.

Real-time RT-PCR studies on MsrB gene expression at the mRNA level after downregulation of MsrA expression by siRNA (168) transfection. A: MsrA mRNA levels; (B) MsrB1 mRNA levels; (C) MsrB2 mRNA levels. D: MsrB3 RNA levels. MsrB3 is the only one showing significantly increased mRNA expression after MsrA knockdown. E: MsrA protein levels from densitometry of Western blots shown in F. F: Western blotting assays on MsrA protein and β-actin after treating MESCs with MsrA specific siRNA (168) or negative control siRNA (882) for days 1, 2, and 3. Triplets were used in each experiment. Two independent experiments were performed for real-time RT-PCRs and three Western blotting experiments were done. Results were averaged with standard errors of mean (SEM) presented with error bars. 168-1 represent samples collected on day 1 with siRNA (168) treatment. Results from MsrA specific siRNA (168) treated samples were labeled with asterisks (*) if there are statistically significant differences from negative control siRNA (882) treated groups (P ≤0.05).
