
Figure 2.
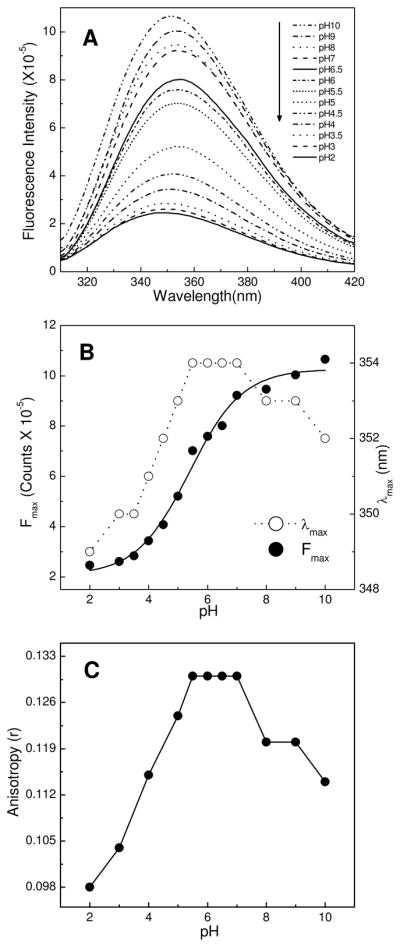
Effect of pH on intrinsic tryptophan fluorescence of HET-C2. A) Emission spectra of HET-C2 acquired at indicated pH values; B) Fluorescence emission intensity maxima and wavelength maxima (λmax) plotted as a function of pH. C) Fluorescence anisotropy values of HET-C2 at various pH values. Protein concentration was 1 μM. Fluorescence excitation occurred at 295 nm and emission measurements were performed as detailed in the Experimental Procedures.