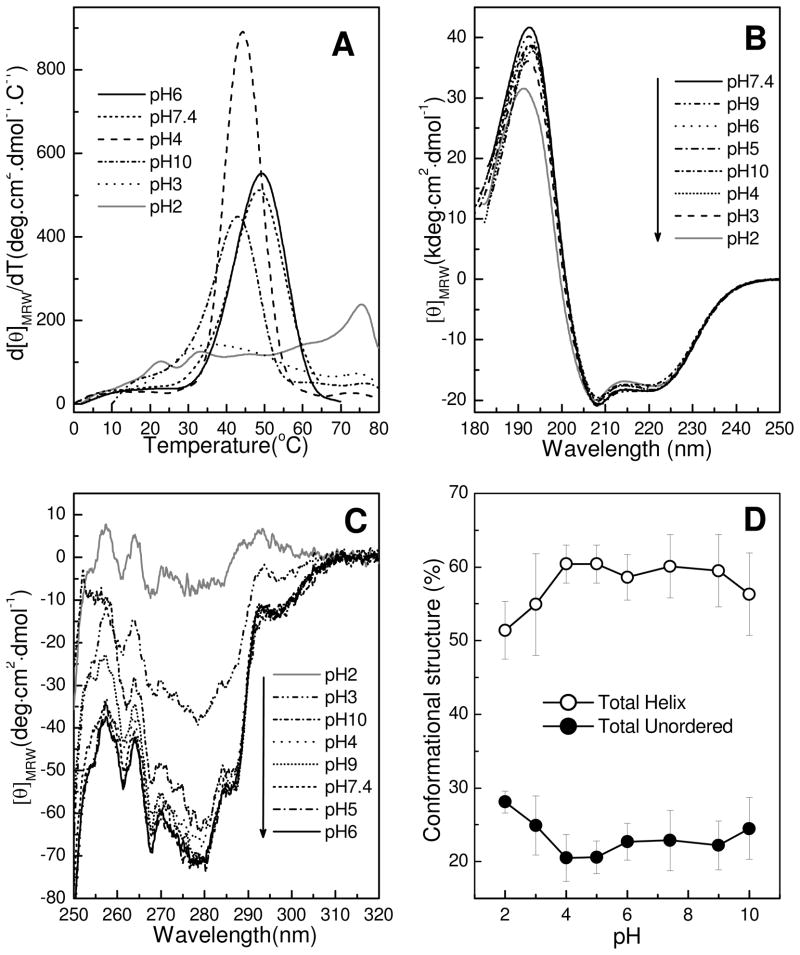
Figure 3.
pH Induced conformational changes of HET-C2 at different pH values. Far-UV and near-UV CD spectra of 50 μM HET-C2 were acquired at 10°C using a J-810 spectropolarimeter as detailed in the Experimental Procedures. A) Temperature dependence of molar ellipticity at 222 nm (derivative plot). Unfolding of HET-C2 is shifted to lower temperature at pH 3 and unfolding cooperativity is completely lacking at pH 2. B) Far-UV CD spectra at different pH values presented in units of molar ellipticity per residue. The negative bands at ~208 nm and positive bands at ~192 nm are characteristic of high helical content, with large negative n-π* transitions at 222 nm and π-π* transitions split into two transitions because of exciton coupling. HET-C2 secondary structure is nearly identical at all pHs tested. C) Near-UV CD spectra. The strong signal response from Tyr and Trp in HET-C2 at moderate pH is moderately disrupted at pH 3 and is almost completely lost at pH 2, consistent with diminished tertiary structure. D) Change in HET-C2 secondary structure induced by pH. The plotted values illustrate calculations of HET-C2 secondary structure, presented as part of Supplementary Table S1 and obtained from the far-UV CD spectra.

