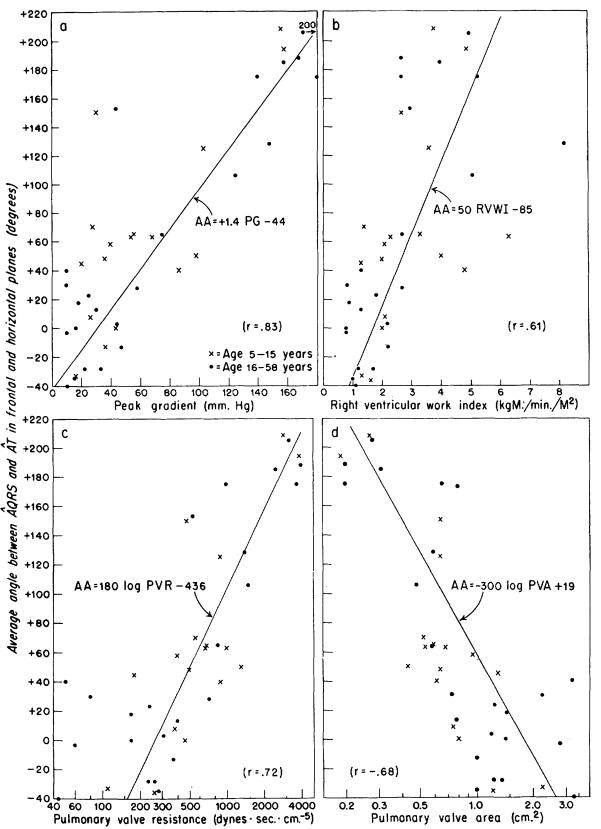
Figure 6.
a to d. Correlation of the average angle (AA) between ÂQRS and ÂT in the frontal and horizontal planes with the hemodynamic data in 40 patients with pulmonary stenosis. The average QRS-T angle was calculated by averaging the QRS-T angles observed in the horizontal and frontal planes for each patient. The angle was called “positive” when the ÂQRS was clockwise from ÂT. The average QRS-T angle correlated better with peak gradient than with work inidex, resistance, or area. a. By the use of the equation, PG = (AA + 44)/1.4, approximate estimations of the gradient across the valve could be made from the electrocardiographic data of patients with pulmonary stenosis.

