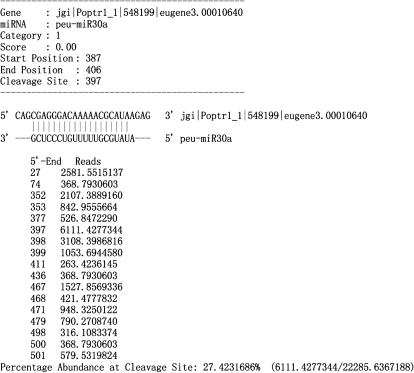
Fig. 3.
Cleavage site distribution of peu-miR30a verified by degradome sequencing. The standard CleaveLand output results for the degradome sequencing analysis of peu-miR30a. ‘Score’, the position penalty score used as the prediction of miRNA targets. ‘Start Position’ and ‘End position’, the start and end location at the miRNA pairing with the target gene sequence. ‘Cleavage site’, the verified cleavage site of the miRNA in the target gene sequence. Below the sequence of miRNA and target, the left column numbers represented all the cleavage sites discovered by degradome sequencing, the right column numbers represent the corresponding sequence reads in tags per million.

