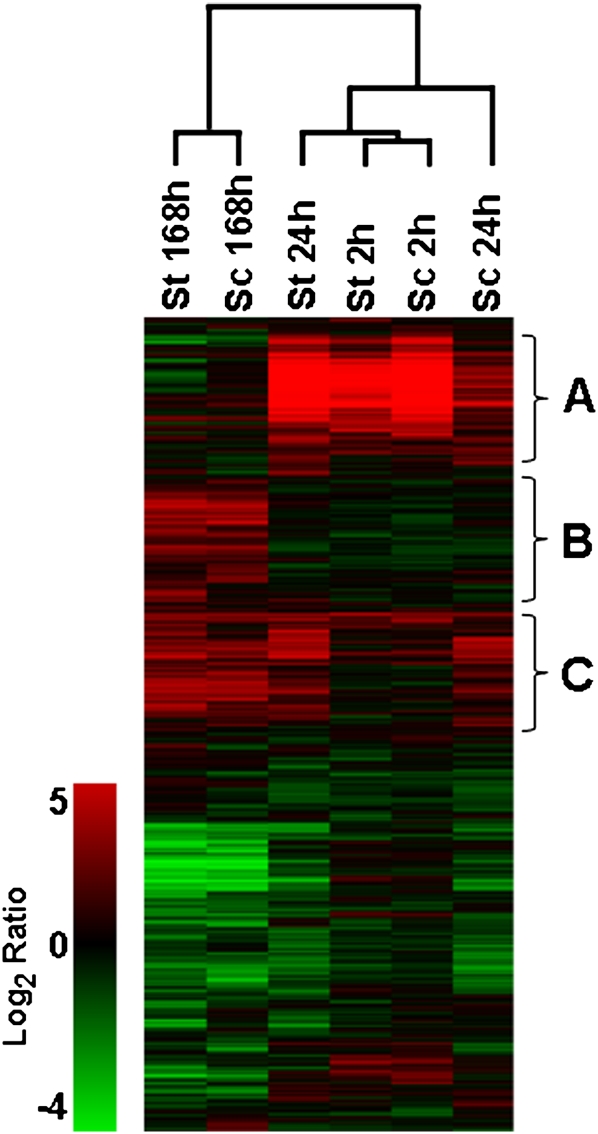
Fig. 1.
Hierarchical clustering of S. commersonii (Sc) and S. tuberosum (St) transcripts at 2, 24, and 168 h of cold treatment at 2 °C. Data are shown as the average log ratio from three biological replicates. The figure shows all spots on the array (including bad flagged spots) prior to statistical selection.

