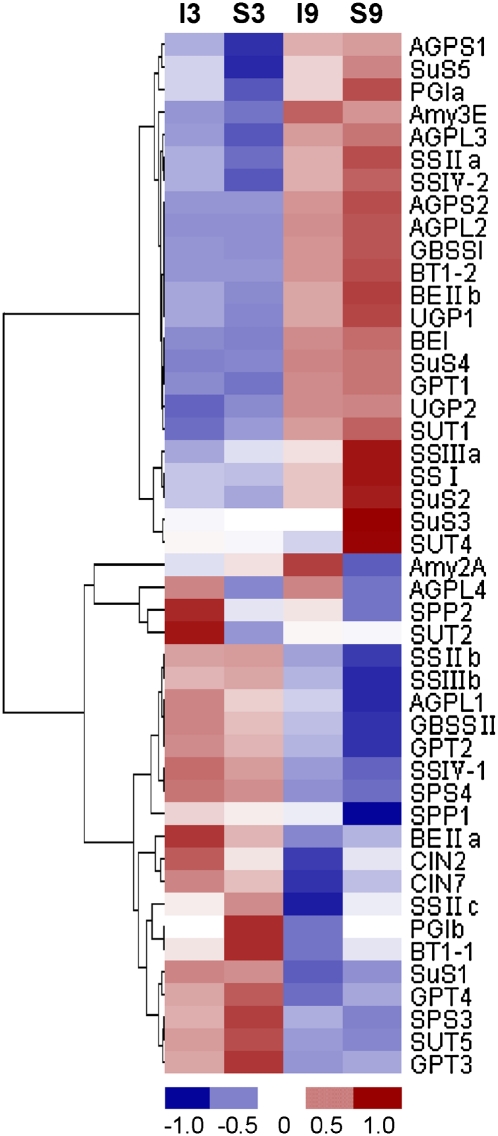
Fig. 2.
Hierarchical clustering of starch metabolism-related genes of rice during grain filling. Horizontal rows represent individual genes and vertical rows represent individual samples. I3, inferior spikelets at 3 DPA; S3, superior spikelets at 3 DPA; I9, inferior spikelets at 9 DPA; S9, superior spikelets at 9 DPA. Red and blue indicate the transcript level above and below the median, respectively, for that gene across all samples. The clustering is performed on the log2-transformed expression values.

