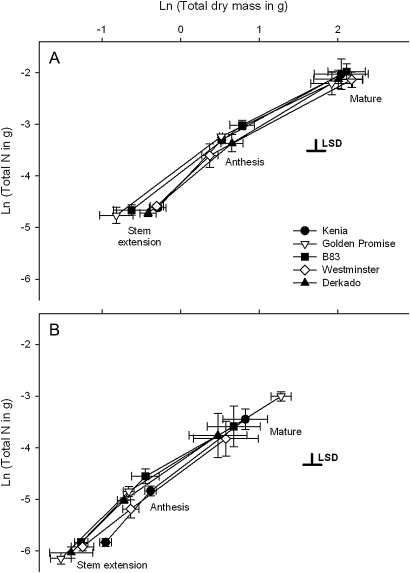
Fig. 1.
Relationship between plant dry mass and N content in (A) standard nutrient supply and (B) reduced (50% standard) nutrient supply at three development stages. Values are the mean (±SE) of ln-transformed data, and least significant difference (LSD) bars are shown for differences between genotypes at the 5% level.

