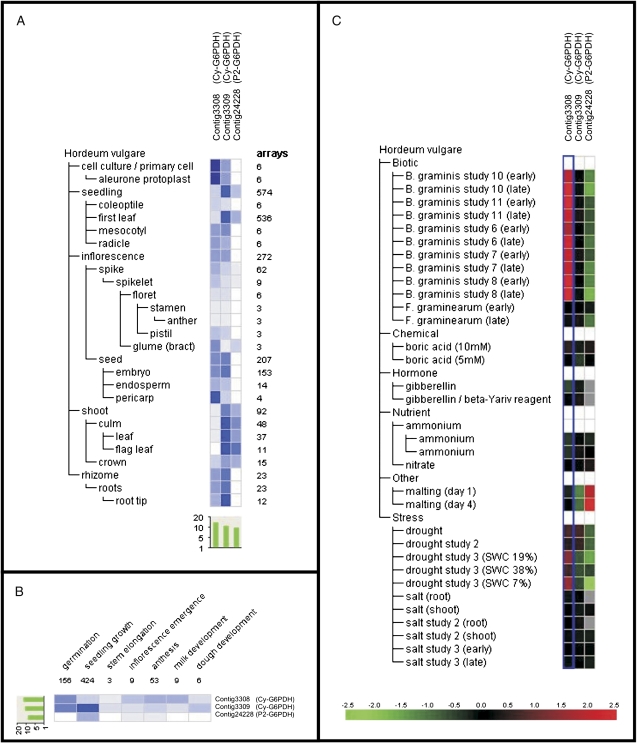
Fig. 7.
Transcript level analysis of barley P2-G6PDH (contig24228) and of two different Cy-G6PDHs (contig3308 and contig3309), using the meta-profile analysis tool in Genevestigator V3 (www.genevestigator.ethz.ch). Transcript levels have been analysed under different abiotic stimuli (A), in different barley organs (B), and at different developmental stages of barley plants (C). Data are log2. In A, the red colour marks up-regulation and the green color marks down-regulation (see reference bar).

