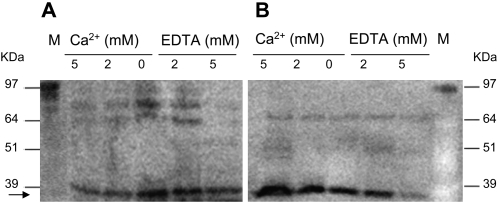
Fig. 3.
Subcellular distribution and Ca2+ response of native Ntann12 proteins. The total protein extract from roots of 4-week-old tobacco plants was treated with either CaCl2 or EDTA before separation of the membrane-enriched and cytosolic fractions and western blot analysis using the anti-Ntann12 antibodies. (A) Cytosolic fraction. (B) Membrane-enriched fraction. For the analysis, 40 μg of membrane-enriched fraction proteins and 60 μg of cytosolic fraction proteins were loaded into gels. M, molecular marker. The arrow denotes the position of the expected size for Ntann12.

