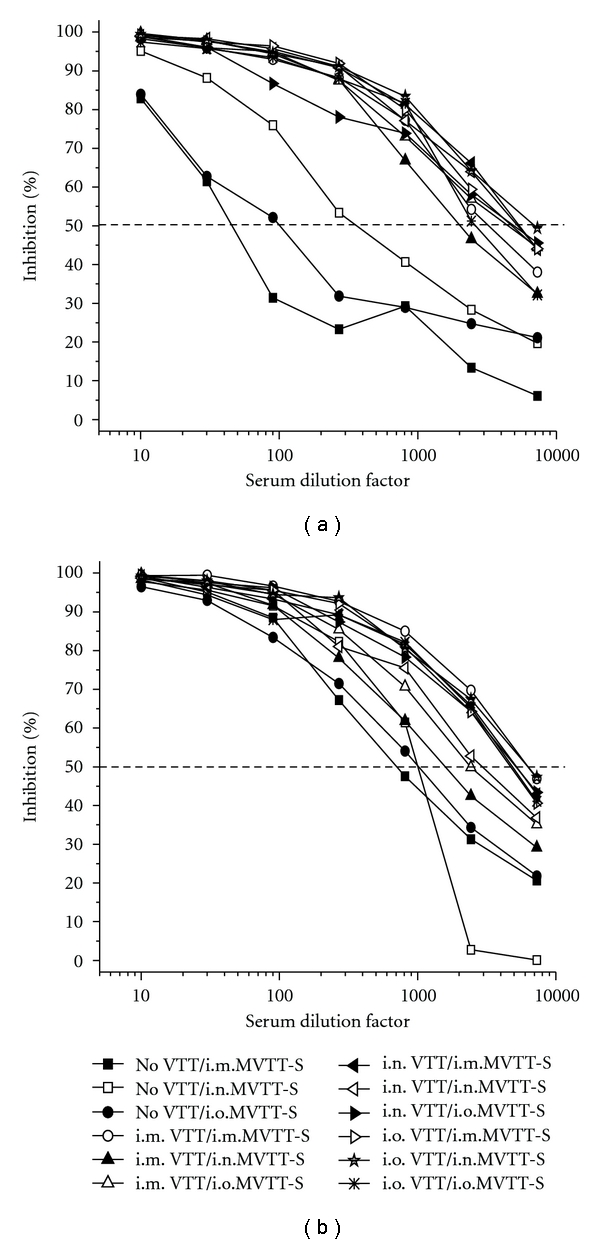
Figure 4.

Anti-VTT neutralizing antibody responses after the first (a) and the second (b) MVTT-S challenges. Serum samples collected three weeks after each of the two MVTT-S challenges were included in this experiment. Pooled sera, which contain an equal amount of serum of each vaccinated mouse in each group, were subjected to each experiment. The X-axis represents the serum dilution factor whereas the Y-axis indicates the percentage of viral inhibition. The dashed horizontal line indicates IC50 values. The experiment was repeated twice with similar results obtained. As controls, no VTT represents mice, who did not receive VTT-vaccination.
