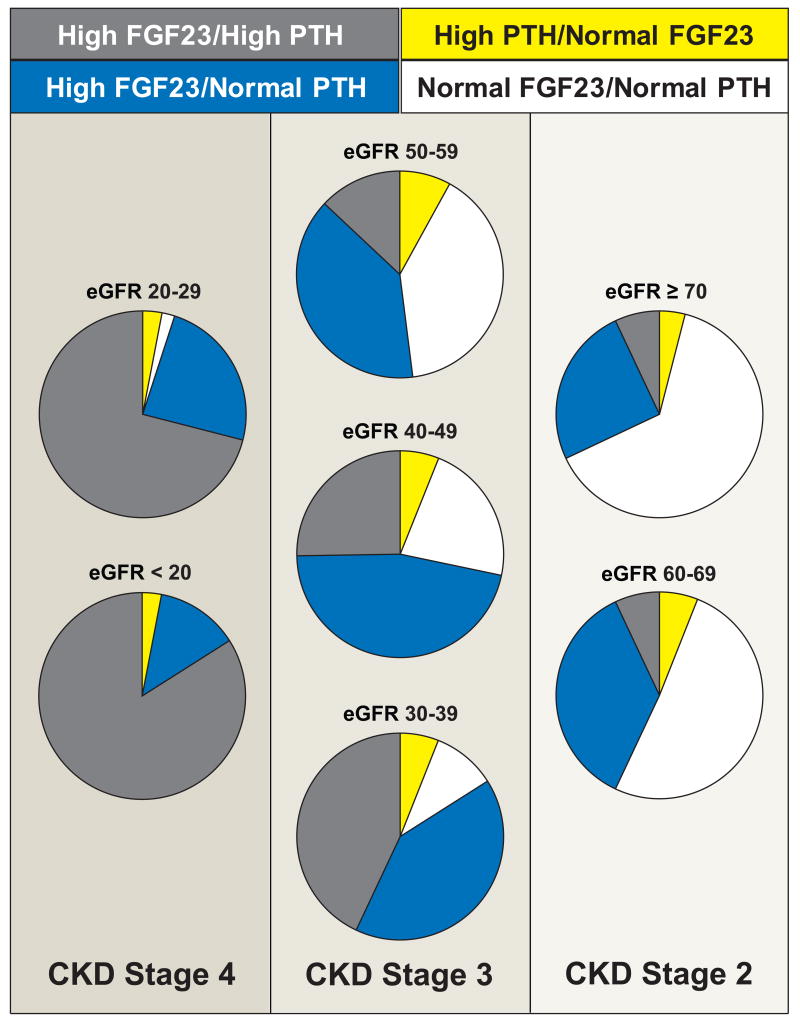
Figure 2. Proportions of participants with normal or high FGF23 and PTH levels within each eGFR category.
Sections of pie charts indicate proportions of individuals with FGF23 and/or PTH abnormalities by eGFR category: white – normal PTH and FGF23 levels; yellow – high PTH/normal FGF23; gray – high FGF23/high PTH; and blue – high FGF23/normal PTH.

