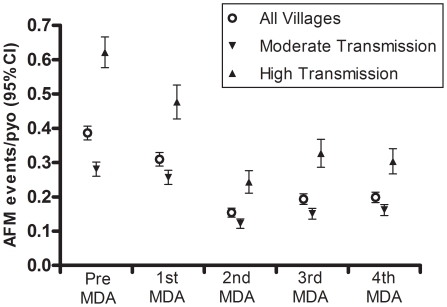
Figure 3. Incidence of acute filariasis morbidity events in moderate and high transmission villages.
The open circles represent data from all 14 study villages combined. Villages are also stratified according to pre-MDA transmission intensity such that the down arrows represent moderate transmission villages (pre-MDA values for 8 villages were 24–167 infective bites per person per year) and up arrows represent high transmission villages (pre-MDA values for 6 villages were 224 to 742 infective bites per persons per year). High transmission villages experienced significantly greater AFM incidence in each year of the study compared to moderate transmission villages (p<0.001).

