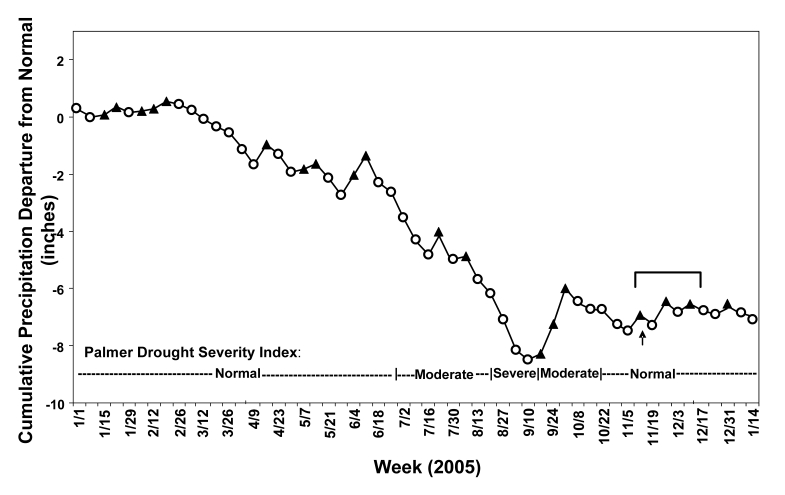
Figure 2.
Cumulative weekly precipitation departures from normal (in inches) during 2005, showing weeks with below ( ) and above (
 ) normal precipitation. A moderate to severe drought resulted from precipitation levels 8.3 inches below normal during the period from March through mid-September 2005. This period of diminished precipitation was followed by a period of above-normal to normal precipitation during which time the pine needle pile was moved on November 21, 2005 (
 ) and subsequently followed by the estimated exposure period for the 21 blastomycosis outbreak case patients (
 ).
).

