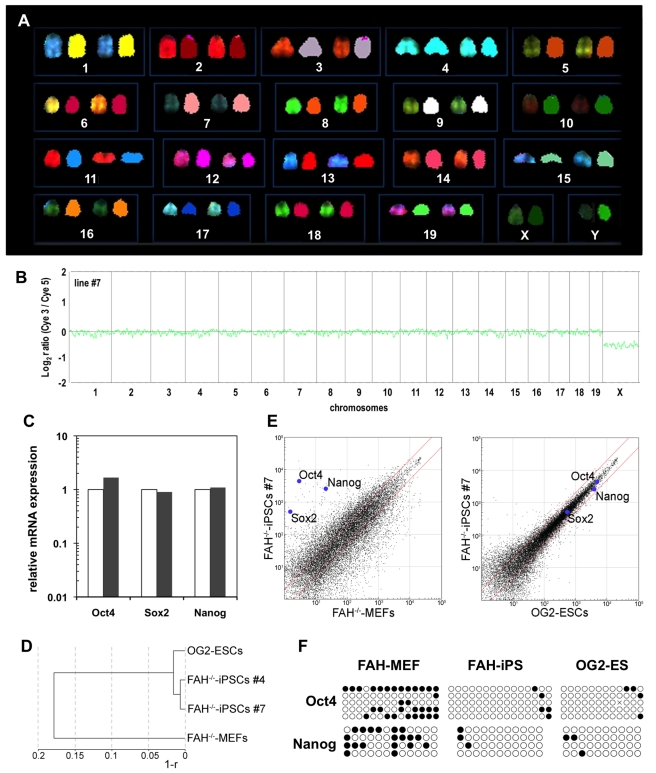
Figure 2. Molecular characterization of FAH −/−-iPS cells.
(A) SKY analysis of line #7 showed a normal male karyotype (40, XY) without any signs of chromosomal abnormalities. Each chromosome is depicted in original fluorescence color (left) and after classification (right). (B) Array CGH analyses of the male FAH−/−–iPS cell line #7 compared with the sex-mixed starting fibroblast (MEF) population further conformed its normal karyotype. (C) Quantitative RT-PCR for the pluripotency factors Oct4, Sox2, and Nanog in FAH −/−-iPS cells compared with OG2 ES cells (normalized to 1). (D) Hierarchical clustering dendrogram of FAH −/−-iPS cell lines based on global expression profile similarity (r: linear correlation coefficient). (E) Scatter plot of global gene expression data comparing FAH −/−-iPS cells with FAH −/−-MEFs (left panel) and FAH −/−-iPS cells with ES cells (right panel). (F) Methylation status of Oct4- and Nanog-promoter regions in fibroblasts (starting cells: FAH −/−-MEFs), FAH −/−-iPS cells, and OG2 ES cells. Black circles depict methylated CpG islets; white circles show unmethylated CpG islets.

