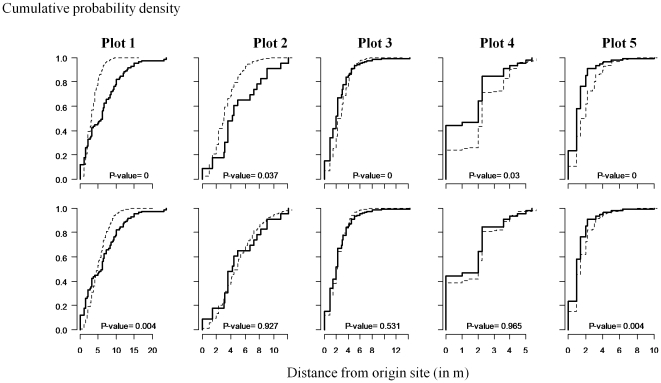
Figure 3. Dispersal distances in the five bananas plots (observed versus simulated by POM).
Simulations were driven for habitat-dependent and habitat-independent models with the respective maximum likelihood estimates. Cumulative distribution plot of simulated distances (dashed line) versus observed distances (bold line) from (a) the habitat-independent model and (b) the habitat-dependent model. P-values correspond to the results of the Kolmogorov-Smirnov test of equal distributions for observed and simulated dispersal distances (based on >100 simulations).

