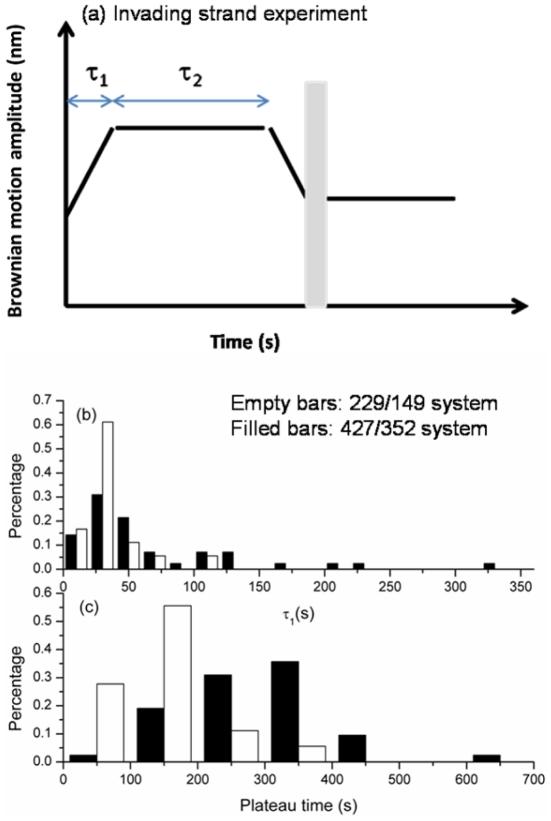
Figure 5. Analysis for invading strand time-courses at two DNA lengths.
Empty bars represent 229/149 nt system; filled bars represent 427/352 nt system. (a). A cartoon of invading strand time-course is used to define various stages of reaction: the duration between the establishment of a tether and the beginning of the plateau is defined as τ1; the duration of the plateau is defined as τ2. Only tethers showing a BM decrease before buffer wash were used for analysis. (b). τ1 exhibited no apparent difference at two different DNA substrates (mean of 28.6±15.1 s and 36.7±13.3 s for 229 and 427 substrates). (c). τ2 histogram shows DNA length dependence for two different DNA substrates (138.6±67.7 s and 289.6±102.9 s for 229 and 427 substrates).

