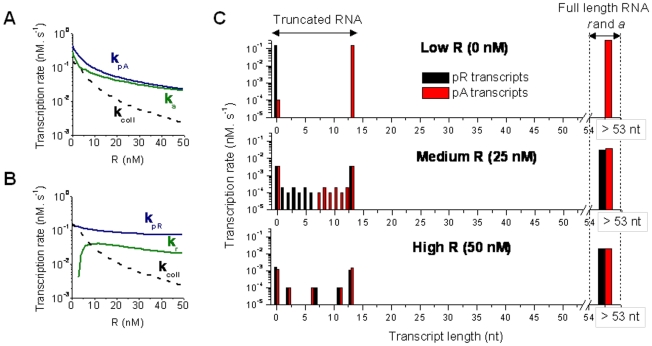
Figure 3. Transcriptional Interference within scbA-scbR locus.
(A–B) Transcription rates ka and kr from promoters pA and pR respectively in presence of TI, the RNAP firing rates  and
and  from promoters pA and pR respectively in absence of TI, and the net rate of RNAP collisions
  due to sitting duck collisions and collision between elongating RNAP, shown for different concentrations of repressor ScbR. (C) Transcription rate of different sizes of truncated RNA (<53 nt) and full-length RNA (a and r) from promoters pR and pA for different levels of repressor R.

